
Tumefactive Demyelination

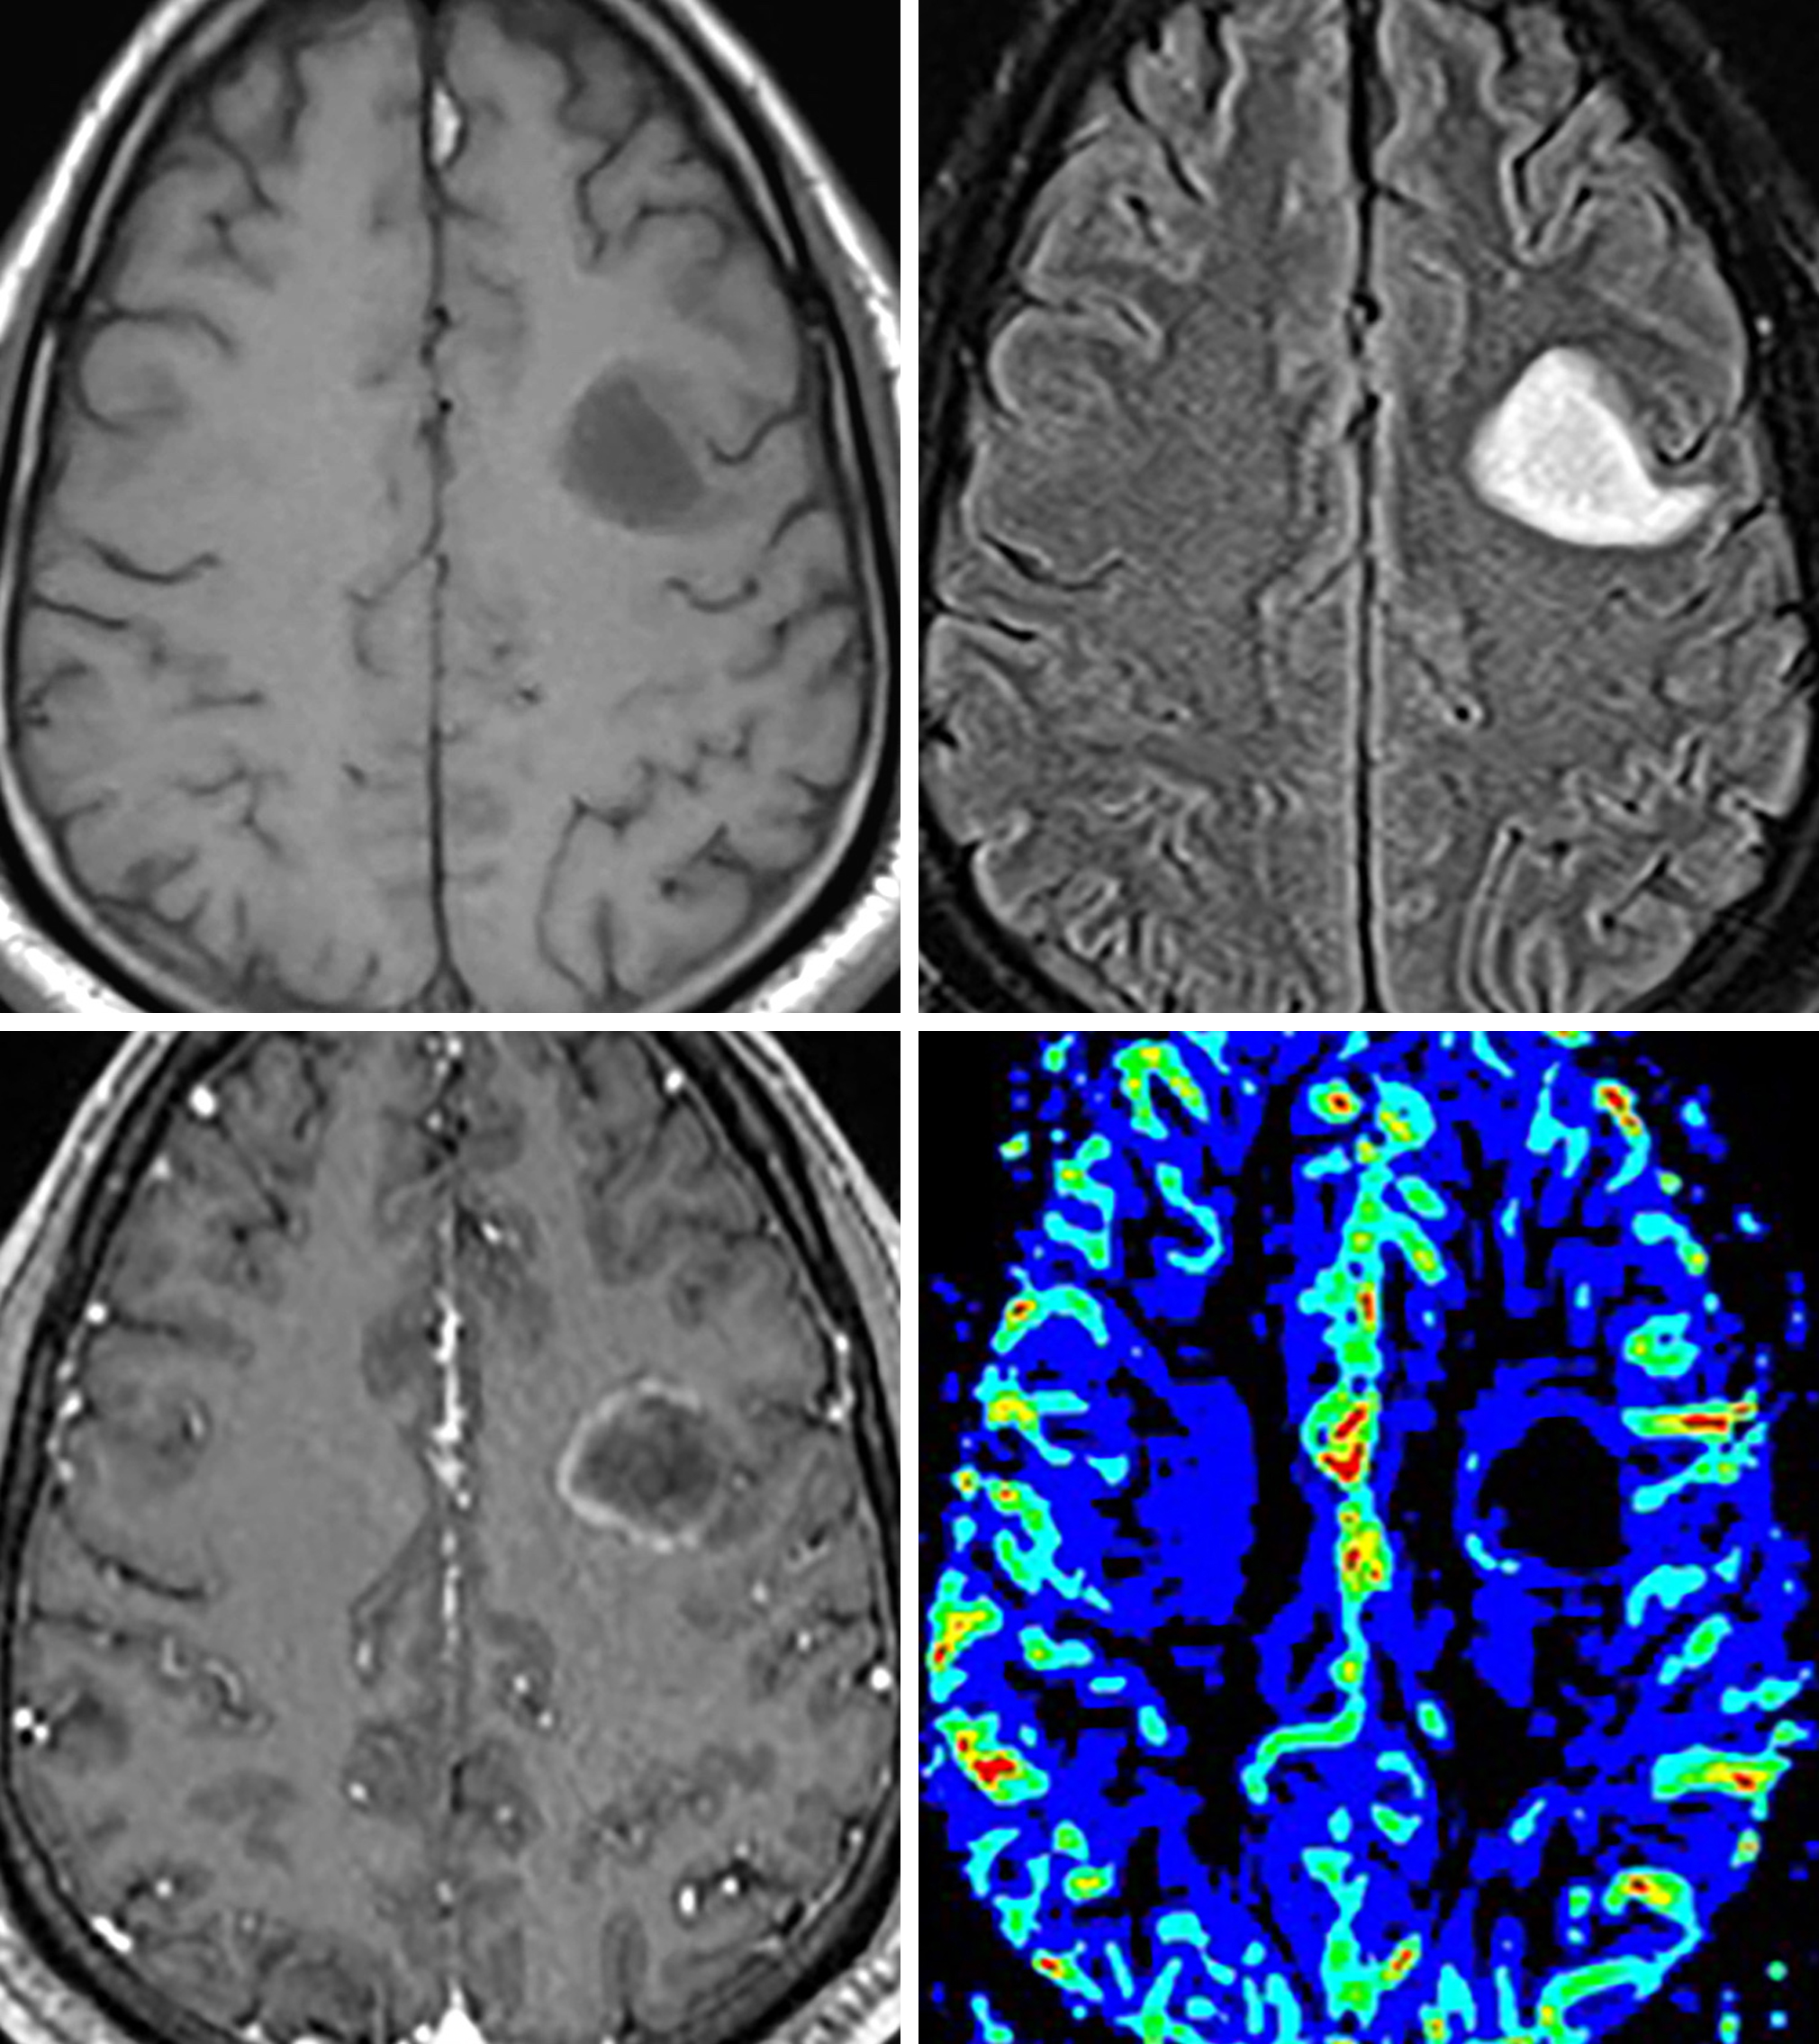
Figure 1: T1-hypointense (top left), oval, subcortical lesion with corresponding FLAIR-hyperintense signal (top right) and faint rim of incomplete (horseshoe) enhancement (bottom left). (Bottom Right) Note the mildly increased cerebral blood volume on MR perfusion imaging along the medial margin. The incomplete rim of enhancement and low T1 signal is fairly classic for a tumefactive, demyelinating lesion. Although perfusion can be mildly increased along the periphery of the lesion, it is often much less than would be expected with a high-grade glioma.
![Figure 2: Tumefactive demyelinating lesions are often large and masslike, demonstrating FLAIR hyperintensity throughout the lesion (top left [sagittal]; top right and bottom left [axial]). These lesions commonly involve the corpus callosum (top left and top right, arrows) and are often confused for lymphoma or glioblastoma . (Bottom Right) As is common for lesions of demyelination, there is vague incomplete peripheral enhancement on postcontrast imaging.](https://assets.neurosurgicalatlas.com/volumes/ATLAS/1-PRINCIPLES_OF_CRANIAL_SURGERY/02-Neuroradiology/04-TumorMimics/27-Tumefactive-MS/PCS_NR_TM_DDX_TumefactiveDemyelination_02.jpg)
Figure 2: Tumefactive demyelinating lesions are often large and masslike, demonstrating FLAIR hyperintensity throughout the lesion (top left [sagittal]; top right and bottom left [axial]). These lesions commonly involve the corpus callosum (top left and top right, arrows) and are often confused for lymphoma or glioblastoma. (Bottom Right) As is common for lesions of demyelination, there is vague incomplete peripheral enhancement on postcontrast imaging.
Description
- Probable autoimmune-mediated demyelination in which environmental factors affect genetically susceptible individuals
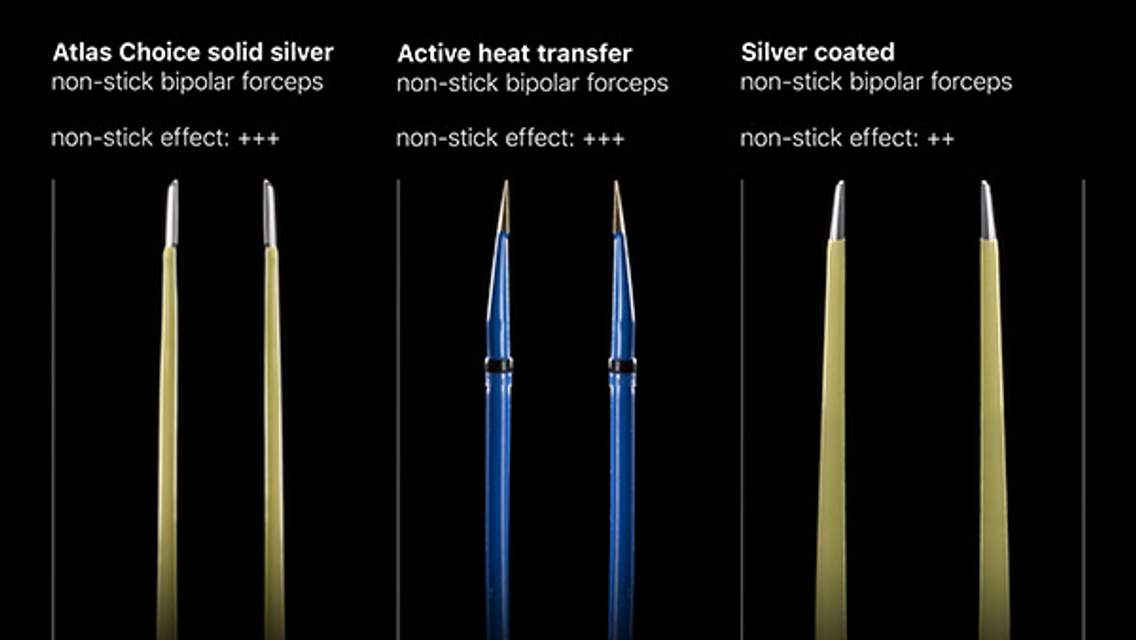
ATLAS Choice Bipolar Forceps
Designed for your every surgical maneuver
Five tip sizes for brain and spine procedures
Unparalleled non-stick and low-profile features
Pathology
- Activated T cells attack myelinated axons
Clinical Features
- Symptoms
- Variable; often initial impaired/double vision of acute optic neuritis
- Weakness, numbness, tingling, gait disturbances, multiple cranial nerve palsies
- Spinal cord symptoms in most patients
- Age of onset
- Peak: 20 to 40 years
- Gender
- Women twice as likely to be affected than men
Imaging
- General
- Callososeptal T2 hyperintensities radiating perpendicularly
- Can have involvement throughout the CNS
- Tumefactive multiple sclerosis
- Locally aggressive form of demyelination manifesting as one or many lesions without significant mass effect or surrounding edema
- Revised McDonald criteria
- Dissemination in time
- Either new T2 or enhancing lesions on follow-up MRI or simultaneous presence of asymptomatic enhancing and nonenhancing lesions at any time
- Dissemination in space
- In at least 2 of the following 4 areas
- Periventricular, juxtacortical, infratentorial, or spinal cord
- In at least 2 of the following 4 areas
- Dissemination in time
- CT
- Isodense to slightly hypodense with variable degrees of (usually peripheral) enhancement if active
- MRI
- T1
- Hypointense to isointense
- Markedly hypointense lesions in the chronic stage
- T2/FLAIR
- Hyperintense, linear foci radiating from ventricles
- DWI
- Uncommonly, restriction associated with acute plaques
- Contrast
- Peripheral or small nodular enhancement suggests active demyelination
- Incomplete rim of enhancement with tumefactive lesions
- MRS
- Decreased N-acetyl-aspartate and increased choline, sometimes overlapping with findings of neoplasm
- Perfusion MRI
- Mean cerebral blood volume within tumefactive lesions said to be less than that in high-grade gliomas and lymphomas
- T1
- Imaging recommendations
- MRI with contrast; include sagittal FLAIR and fat-saturated coronal sequences to assess for optic neuritis
- Spectroscopy and perfusion imaging may be helpful
- Mimic
- Most commonly mimics glioblastoma and lymphoma, particularly when it involves the corpus callosum. Carefully inspect the enhancement pattern, as multiple sclerosis often has a smooth, incomplete ring. If the history of the patient or pattern of enhancement does not help, consider perfusion imaging, which should be normal or decreased.
For more information, please see the corresponding chapter in Radiopaedia.
Contributor: Sean Dodson, MD
References
Cha S, Pierce S, Knopp EA, et al. Dynamic contrast-enhanced T2*-weighted MR imaging of tumefactive demyelinating lesions. AJNR Am J Neuroradiol 2001;22:1109–1116.
Checrallah A, Geha S, Rizk T, et al. Multiple sclerosis mimicking brain tumor: an unusual presentation. J Med Liban 2005;53:45–49.
Huisman TAGM. Tumor-like lesions of the brain. Cancer Imaging 2009;9:S10–S13. doi.org/10.1102/1470-7330.2009.9003
Iwamoto K, Oka H, Utsuki S, et al. Late-onset multiple sclerosis mimicking brain tumor: a case report. Brain Tumor Pathol 2004;21:83–86. doi.org/10.1007/BF02484515
Kim DS, Na DG, Kim KH, et al. Distinguishing tumefactive demyelinating lesions from glioma or central nervous system lymphoma: added value of unenhanced CT compared with conventional contrast-enhanced MR imaging. Radiology 2009;251:467–475. doi.org/10.1148/radiol.2512072071
Saindane AM, Cha S, Law M, et al. Proton MR spectroscopy of tumefactive demyelinating lesions. AJNR Am J Neuroradiol 2002;23:1378–1386.
Please login to post a comment.