Infratentorial (Posterior Fossa) Ependymoma


Figure 1: (Left) This posterior fossa ependymoma is in its typical intraventricular location, squeezing through the right foramen of Luschka on this axial FLAIR image. (Right) Contrast-enhanced T1WI shows typical avid enhancement of this mass. These visible cystic changes are also frequent in ependymoma.

Figure 2: (Top Left) A mildly T2 hyperintense ependymoma involves the fourth ventricle and extends into the extra-axial CSF space through the right foramen of Luschka. This extension is typical for these very malleable tumors. No restricted diffusion is present on DWI (top right) or ADC (middle left), indicating the less dense cellularity that is more typical of ependymoma. The extent of this ependymoma can be seen as typical heterogeneously enhancing tumor on contrast-enhanced imaging (middle right, axial lower posterior fossa; bottom left, axial foramen magnum; bottom right, sagittal). The enhancing vertebral arteries are encased but remain patent on these contrast-enhanced images, also indicated by the patent black flow void on T2 (top left).
BASIC DESCRIPTION
- Slow-growing tumor arising from ependymal cells (radial glial cells) within the posterior fossa (PF)
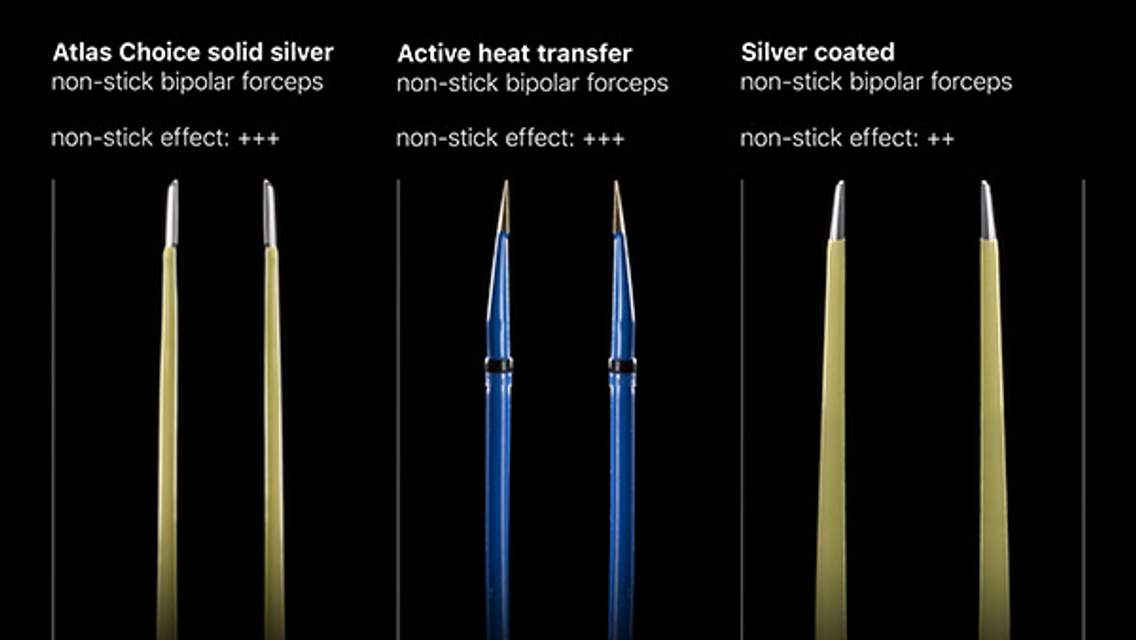
ATLAS Choice Bipolar Forceps
Designed for your every surgical maneuver
Five tip sizes for brain and spine procedures
Unparalleled non-stick and low-profile features
PATHOLOGY
- WHO grade II or III
- Three histologic subtypes
- PF ependymoma, PF ependymoma type A, PF ependymoma type B
- Useful for risk stratification
- Subtype A highly malignant
- Calcification common (50%); small cysts may be seen
- ±Cerebrospinal fluid (CSF) dissemination
CLINICAL FEATURES
- Subtype A: mean patient age at diagnosis, 3 years
- Subtype B: mean age, 30 years
- Slight male gender predilection
- Common presenting symptoms
- Headache, nausea, and vomiting due to increased intracranial pressure
- Irritability, lethargy, and developmental delay in infants
- Prognosis
- 90% to 95% 5-year survival for subtype B
- 50% 5-year survival for subtype A
- Treatment: gross-total resection followed by XRT; chemotherapy provides no survival benefit
IMAGING FEATURES
- General
- Well-marginated, lobulated mass
- Majority arise within fourth ventricle floor and extend through/widen ventricular foramina (Luschka, Magendie) into adjacent parenchyma and basal cisterns
- Displaces rather than invades adjacent parenchyma
- ±Hemorrhage, cysts, and necrosis
- CT
- Lobulated, often calcified mass arising within inferior portion of the fourth ventricle
- ±Cysts, hemorrhage
- Variable enhancement on contrast-enhanced CT
- MRI
- T1WI: heterogeneous, often hypointense; areas of calcification and hemorrhage appear hyperintense
- T2WI: intermediate signal intensity; hyperintense cystic components; areas of hemorrhage and calcification appear hypointense
- FLAIR: heterogeneously hyperintense
- T2*GRE: signal blooming secondary to calcification and/or hemosiderin deposition from blood products
- DWI: usually does not show restricted diffusion
- T1WI+C: variable enhancement
- MR spectroscopy (MRS): elevated Cho and lactate, decreased NAA; MRS not generally helpful in distinguishing between posterior fossa medulloblastomas and astrocytomas
IMAGING RECOMMENDATIONS
- MRI with contrast, CT for demonstration of calcification, MRS may be useful adjunct
For more information, please see the corresponding chapter in Radiopaedia.
Contributor: Rachel Seltman, MD
References
Good CD, Wade AM, Hayward RD, et al. Surveillance neuroimaging in childhood intracranial ependymoma: how effective, how often, and for how long? J Neurosurg 2001;94:27–32. doi.org/10.3171/jns.2001.94.1.0027.
Louis DN, Ohgaki H, Wiestler OD, et al. The 2007 WHO classification of tumours of the central nervous system. Acta Neuropathol 2007;114:547. doi.org/10.1007/s00401-007-0243-4.
Merchant TE, Li C, Xiong X, et al. Conformal radiotherapy after surgery for paediatric ependymoma: a prospective study. Lancet Oncol 2009;10:258–266. doi.org/10.1016/s1470-2045(08)70342-5.
Osborn AG, Salzman KL, Jhaveri MD. Diagnostic Imaging (3rd ed). Elsevier, Philadelphia, PA; 2016.
Yuh EL, Barkovich AJ, Guptacorresponding N. Imaging of ependymomas: MRI and CT. Childs Nerv Syst 2009;25:1203–1213. doi.org/10.1007/s00381-009-0878-7.
Please login to post a comment.