Encephalocele

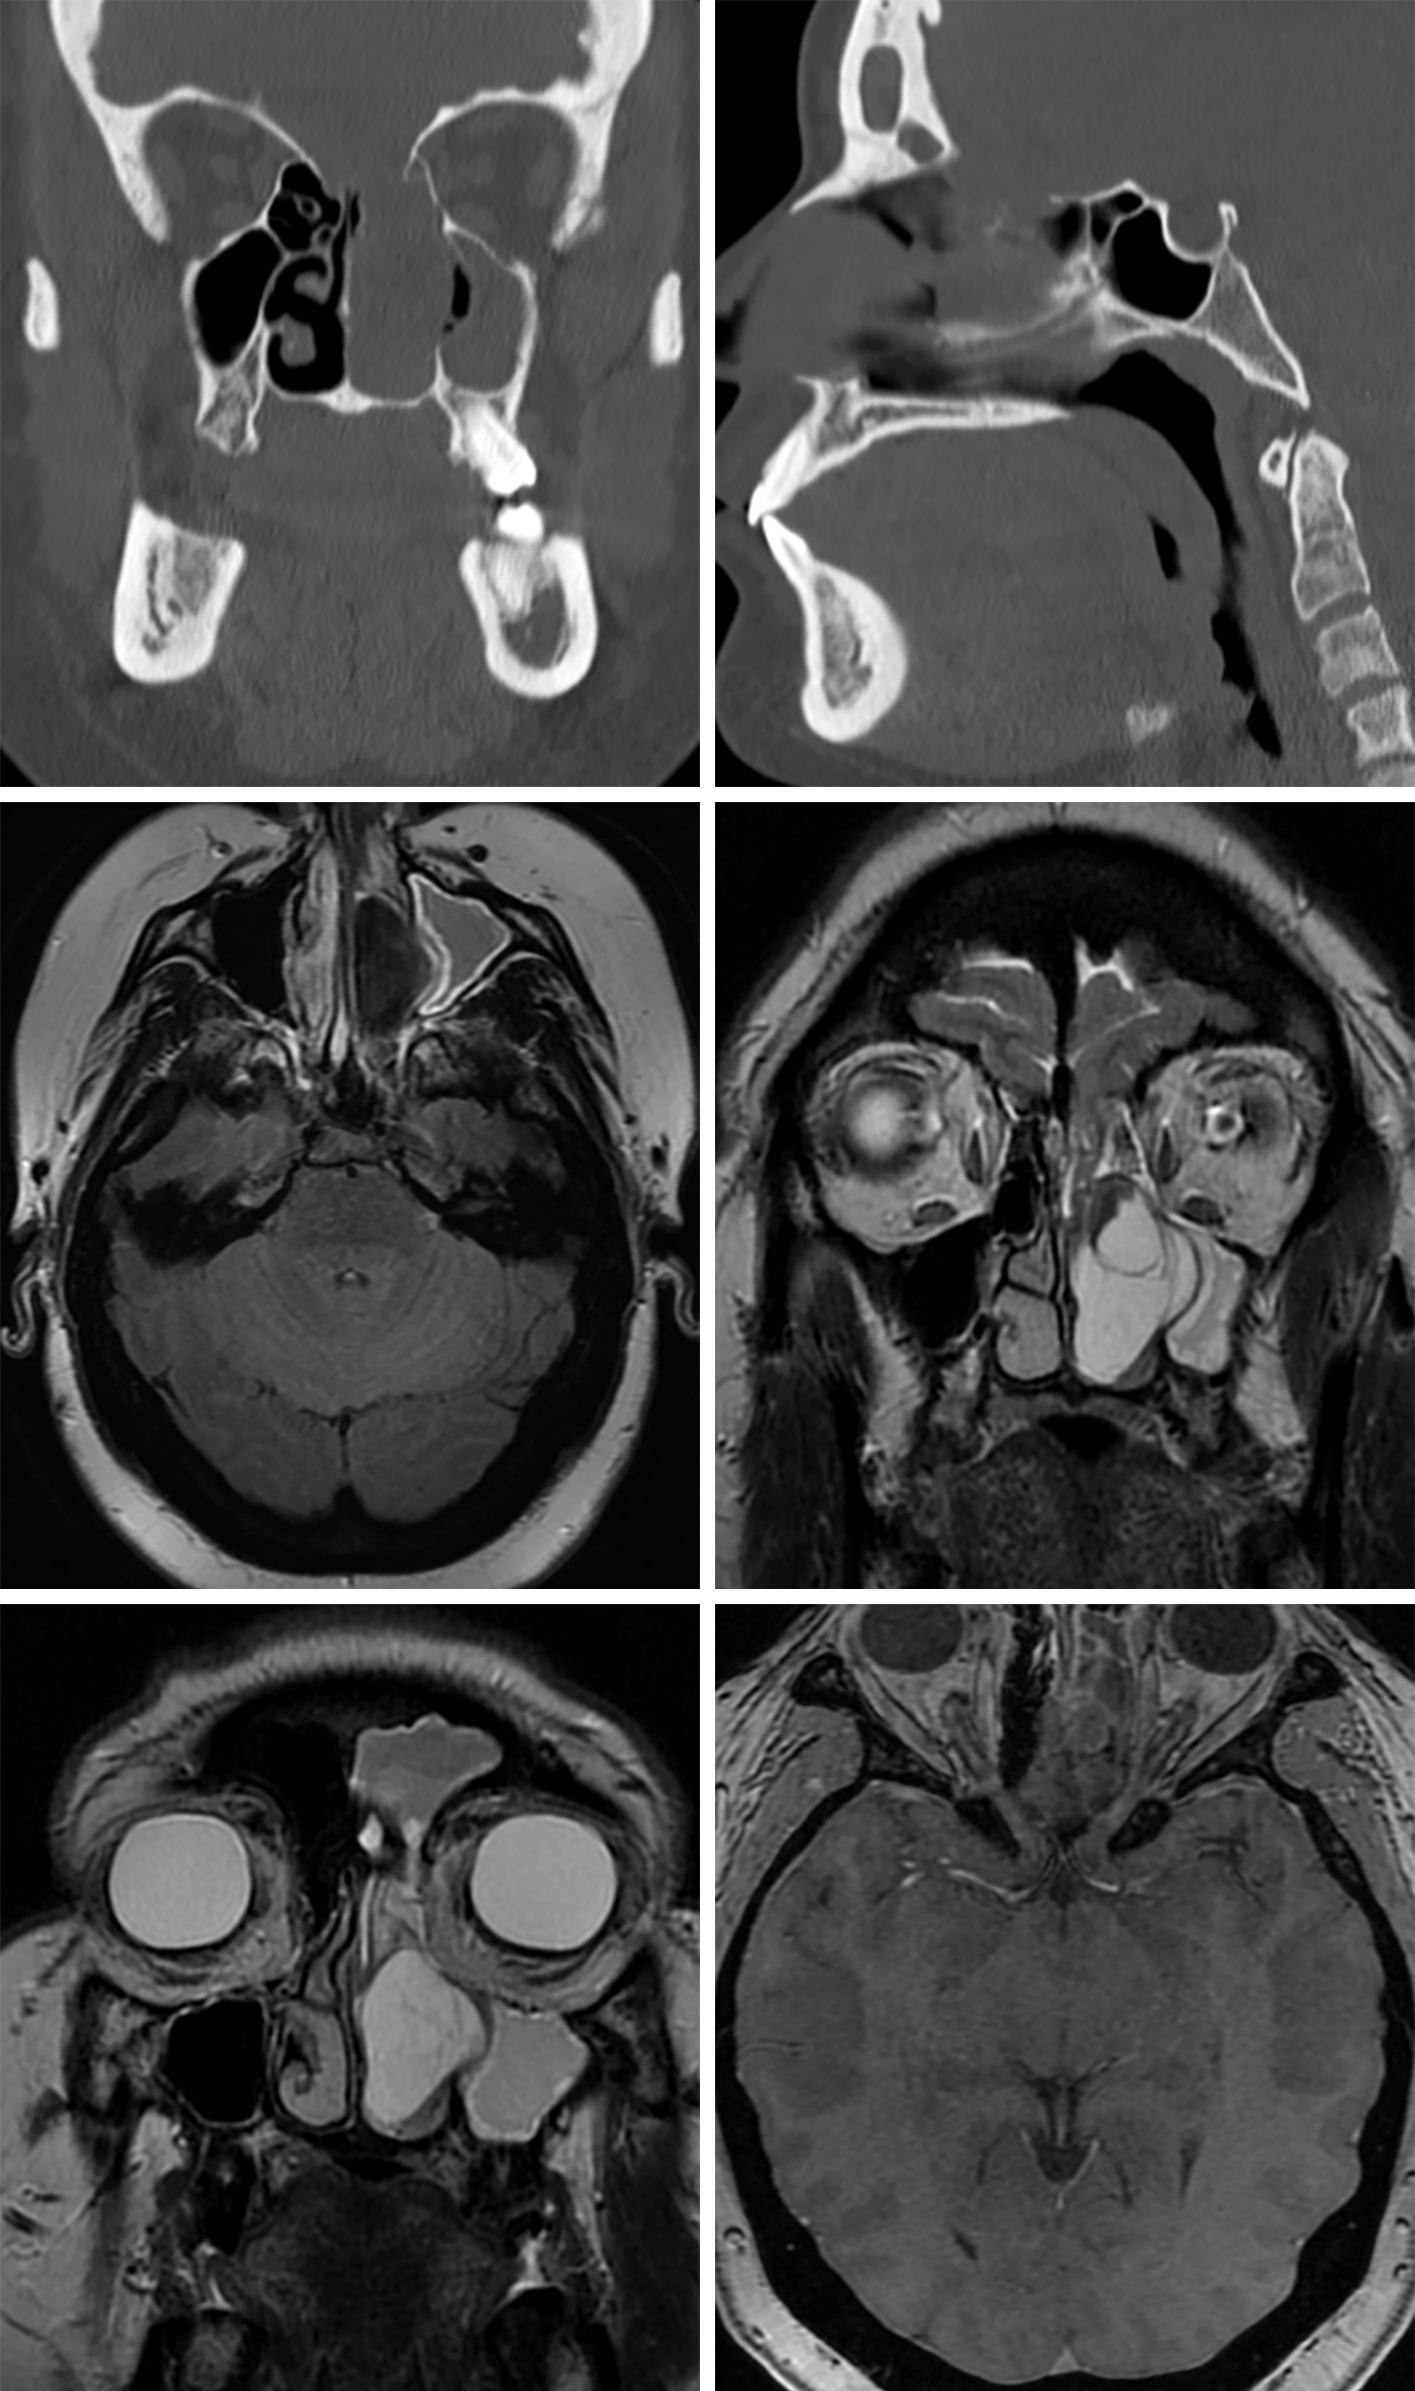
Figure 1: Adult encephalocele. Coronal (top left) and sagittal (top right) CT imaging through the nasal cavity demonstrates a defect in the left cribriform plate and a portion of the fovea ethmoidalis. The left ethmoid sinuses and left nasal cavity are occluded by fluid or soft tissue. The dark signal on axial FLAIR (middle left) and bright signal on coronal T2-weighted (middle right and bottom left) images indicate that the abnormality is made up primarily of fluid, but the T2-weighted images show small amounts of intermediate-signal soft tissue that represents herniated/ectopic brain parenchyma. (Middle Right) The connection between the encephalocele and the left frontal lobe can be seen on coronal T2-weighted imaging. (Bottom Right) As expected, there is little to no enhancement in this lesion on T1+C imaging. The occlusion of the left maxillary sinus (top left, middle left, middle right, and bottom left) and left frontal sinus (top right and bottom left) are secondary to obstruction by the encephalocele.
![Figure 2: Child occipital encephalocele. Encephaloceles can be quite large, but the parenchyma within the encephalocele should be similar in its signal intensity to that of normal brain parenchyma, as demonstrated on axial FLAIR (top left) and T1-weighted (top right [axial] and bottom [sagittal]) imaging. The size of the calvarial defect, thickness of the encephalocele pedicle, and involved intracranial structures can be clearly seen with MRI. Variable amounts of cerebrospinal fluid (CSF) can be seen in the protruding defect. Very little CSF is present in this encephalocele.](https://assets.neurosurgicalatlas.com/volumes/ATLAS/1-PRINCIPLES_OF_CRANIAL_SURGERY/02-Neuroradiology/04-TumorMimics/12.1-Encephalocele/PCS_NR_TM_Enceph_02.jpg)
Figure 2: Child occipital encephalocele. Encephaloceles can be quite large, but the parenchyma within the encephalocele should be similar in its signal intensity to that of normal brain parenchyma, as demonstrated on axial FLAIR (top left) and T1-weighted (top right [axial] and bottom [sagittal]) imaging. The size of the calvarial defect, thickness of the encephalocele pedicle, and involved intracranial structures can be clearly seen with MRI. Variable amounts of cerebrospinal fluid (CSF) can be seen in the protruding defect. Very little CSF is present in this encephalocele.
Please login to post a comment.